Install Grafana
Hi there, I am a learner first and then an IT enthusiast. I have started exploring and ocean of DevOps Tools and tech.
Installation
To install Grafana you can follow the Grafana official documents.
First Identify which Linux OS are you using. To know this, You can hit this command on the terminal
cat /etc/*releaseorcat /etc/os-release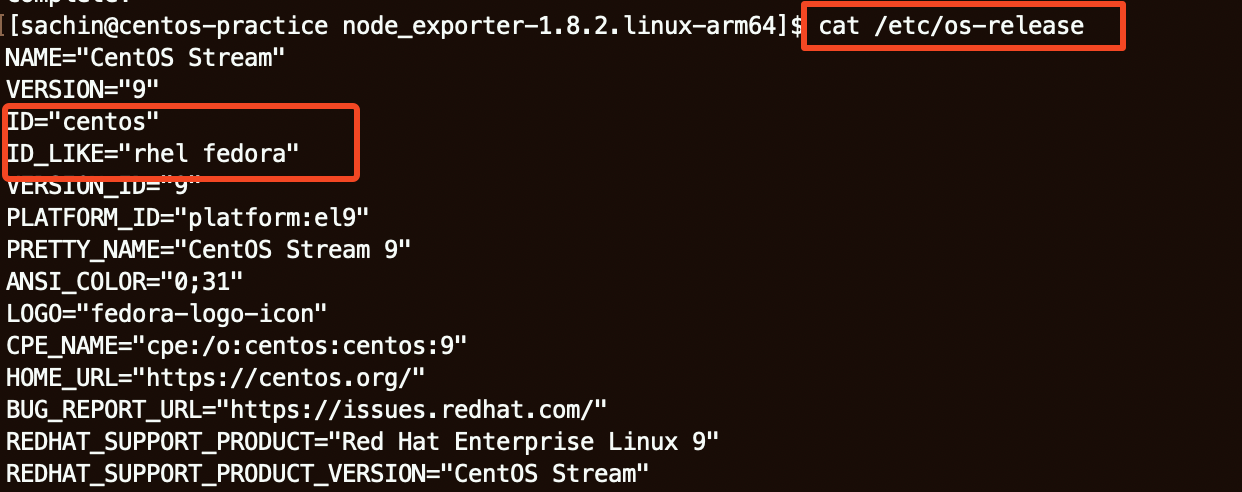
In my case its RHEL or Fedora, So I am using this install link. https://grafana.com/docs/grafana/latest/setup-grafana/installation/redhat-rhel-fedora/
Import the GPG key.
 sudo wget -q -O gpg.key https://rpm.grafana.com/gpg.key
 sudo rpm --import gpg.key
Create
sudo vi /etc/yum.repos.d/grafana.repowith the following content:[grafana] name=grafana baseurl=https://rpm.grafana.com repo_gpgcheck=1 enabled=1 gpgcheck=1 gpgkey=https://rpm.grafana.com/gpg.key sslverify=1 sslcacert=/etc/pki/tls/certs/ca-bundle.crtInstall the Grafana package
sudo dnf install grafana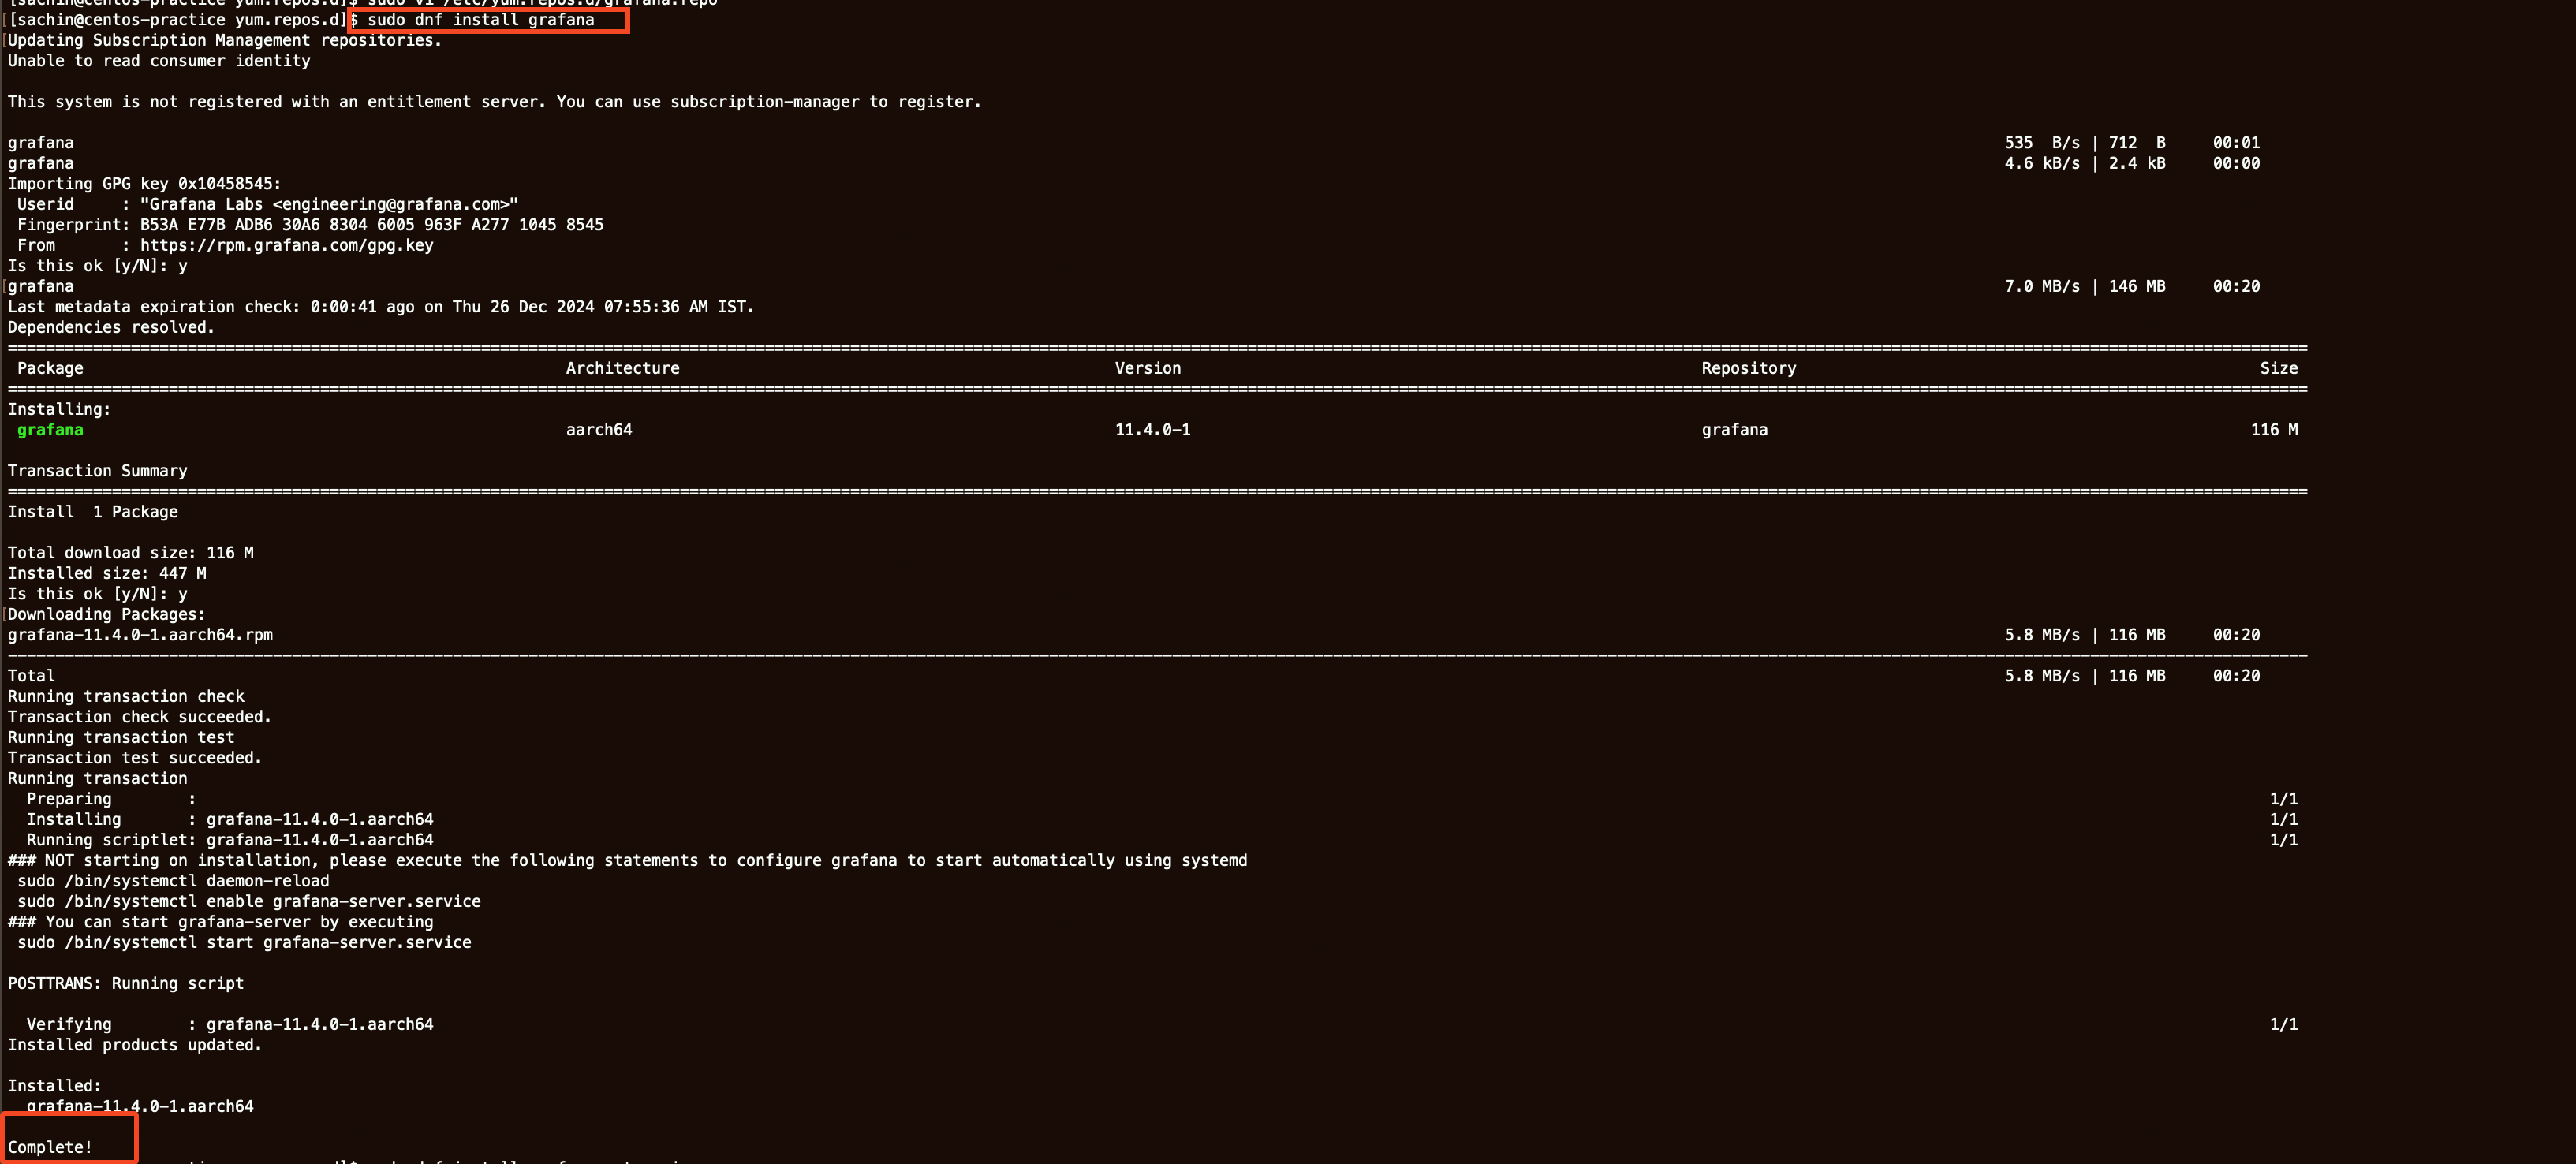
Now that
Grafanais successfully installed its time to start theGrafanaservice. To do this run these commands.sudo systemctl daemon-reload sudo systemctl start grafana-serverCheck if the service is running or not.
sudo systemctl status grafana-serverConfigure the Grafana server to start at boot using systems. To configure the Grafana server to start at boot, run the following command:
sudo systemctl enable grafana-server.serviceSign in to Grafana
To sign in to
Grafanause this endpointhttp://localhost:3000, So open any browser and enter this URL. Grafana uses3000port by default. You can change it from the config file if you want.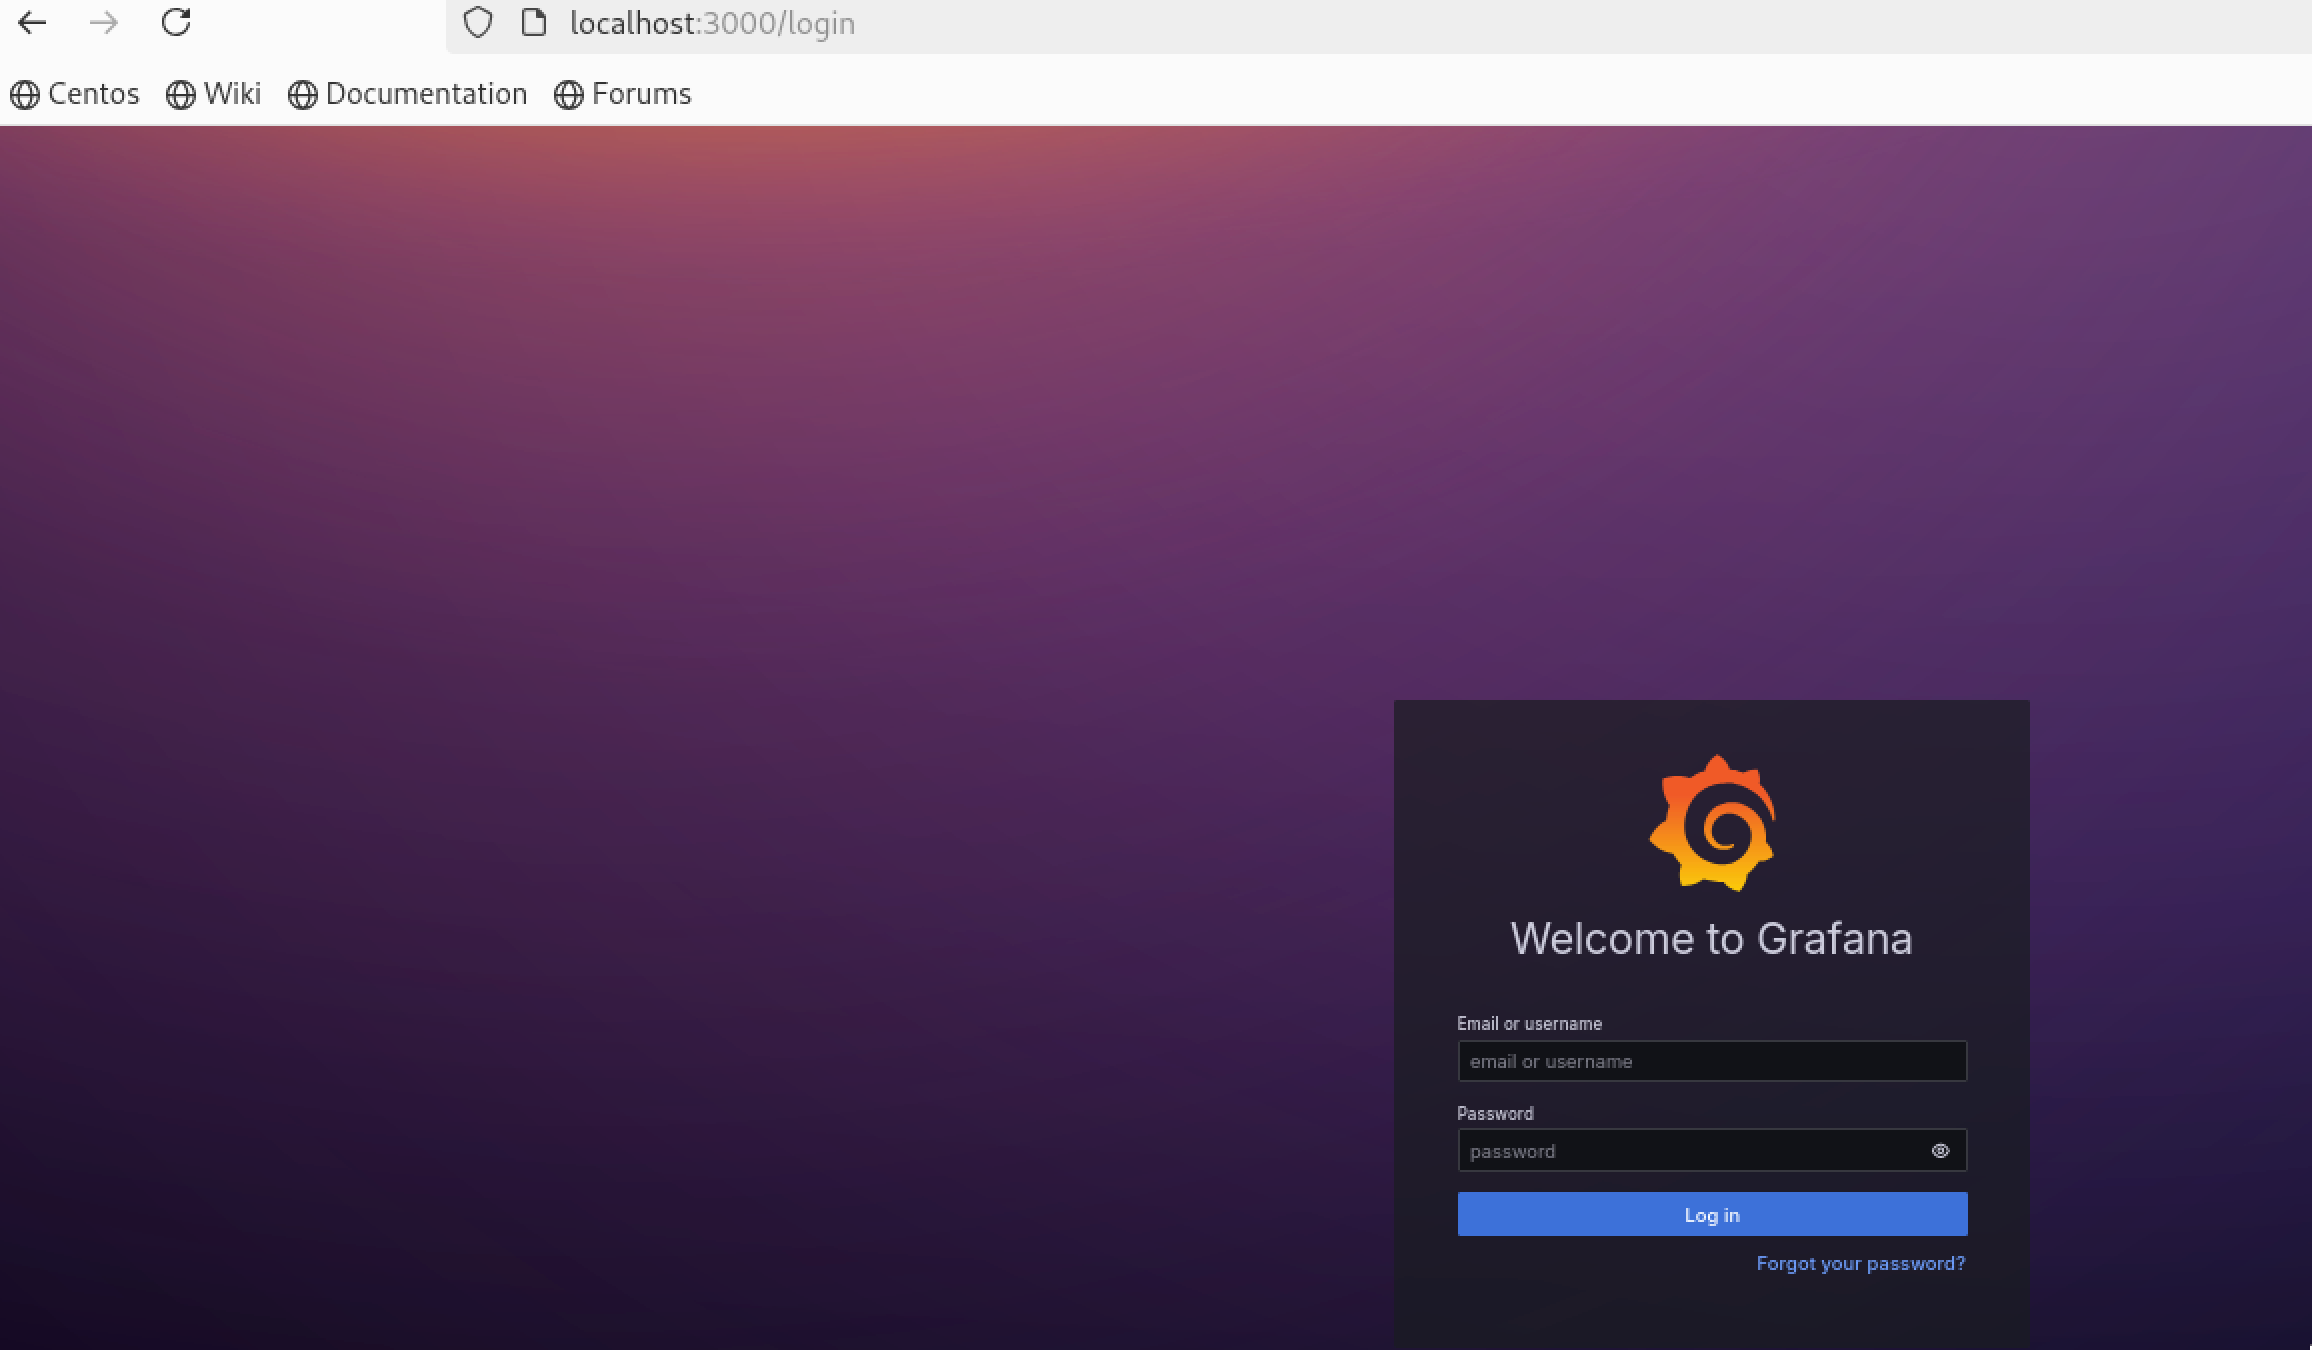
On the sign-in page, enter
adminfor both the username and password.Click Sign in.
If successful, you’ll see a prompt to change the password.
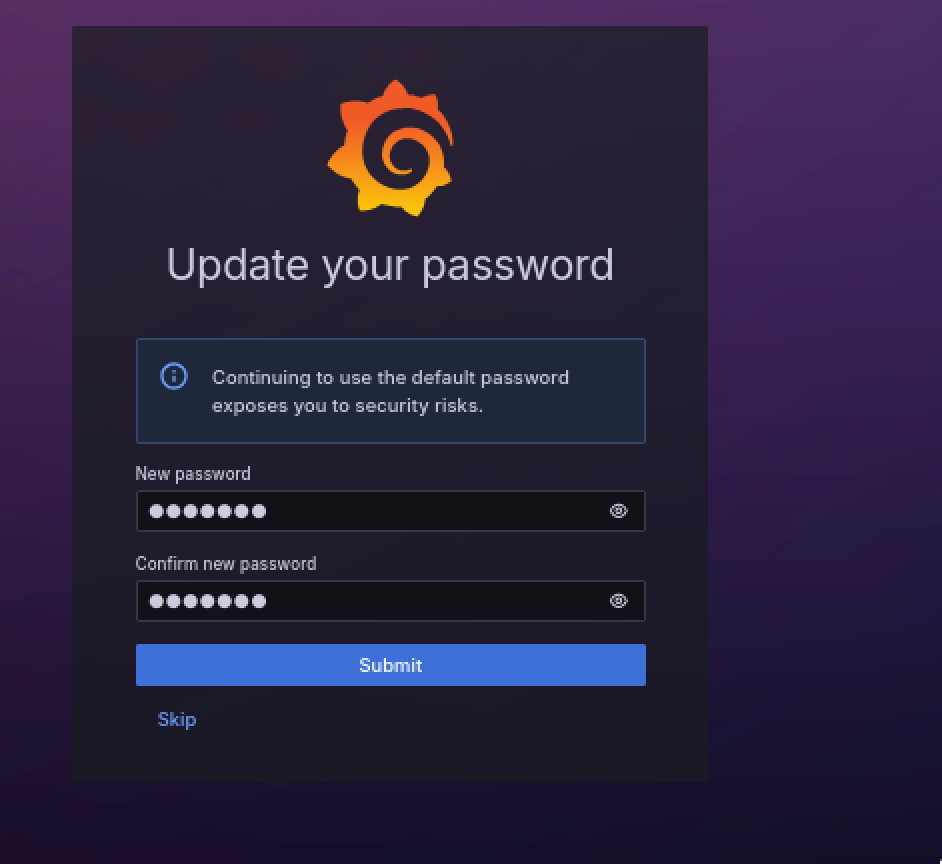
Click Submit on the prompt and change your password.
Note
strongly recommended that you change the default administrator password.
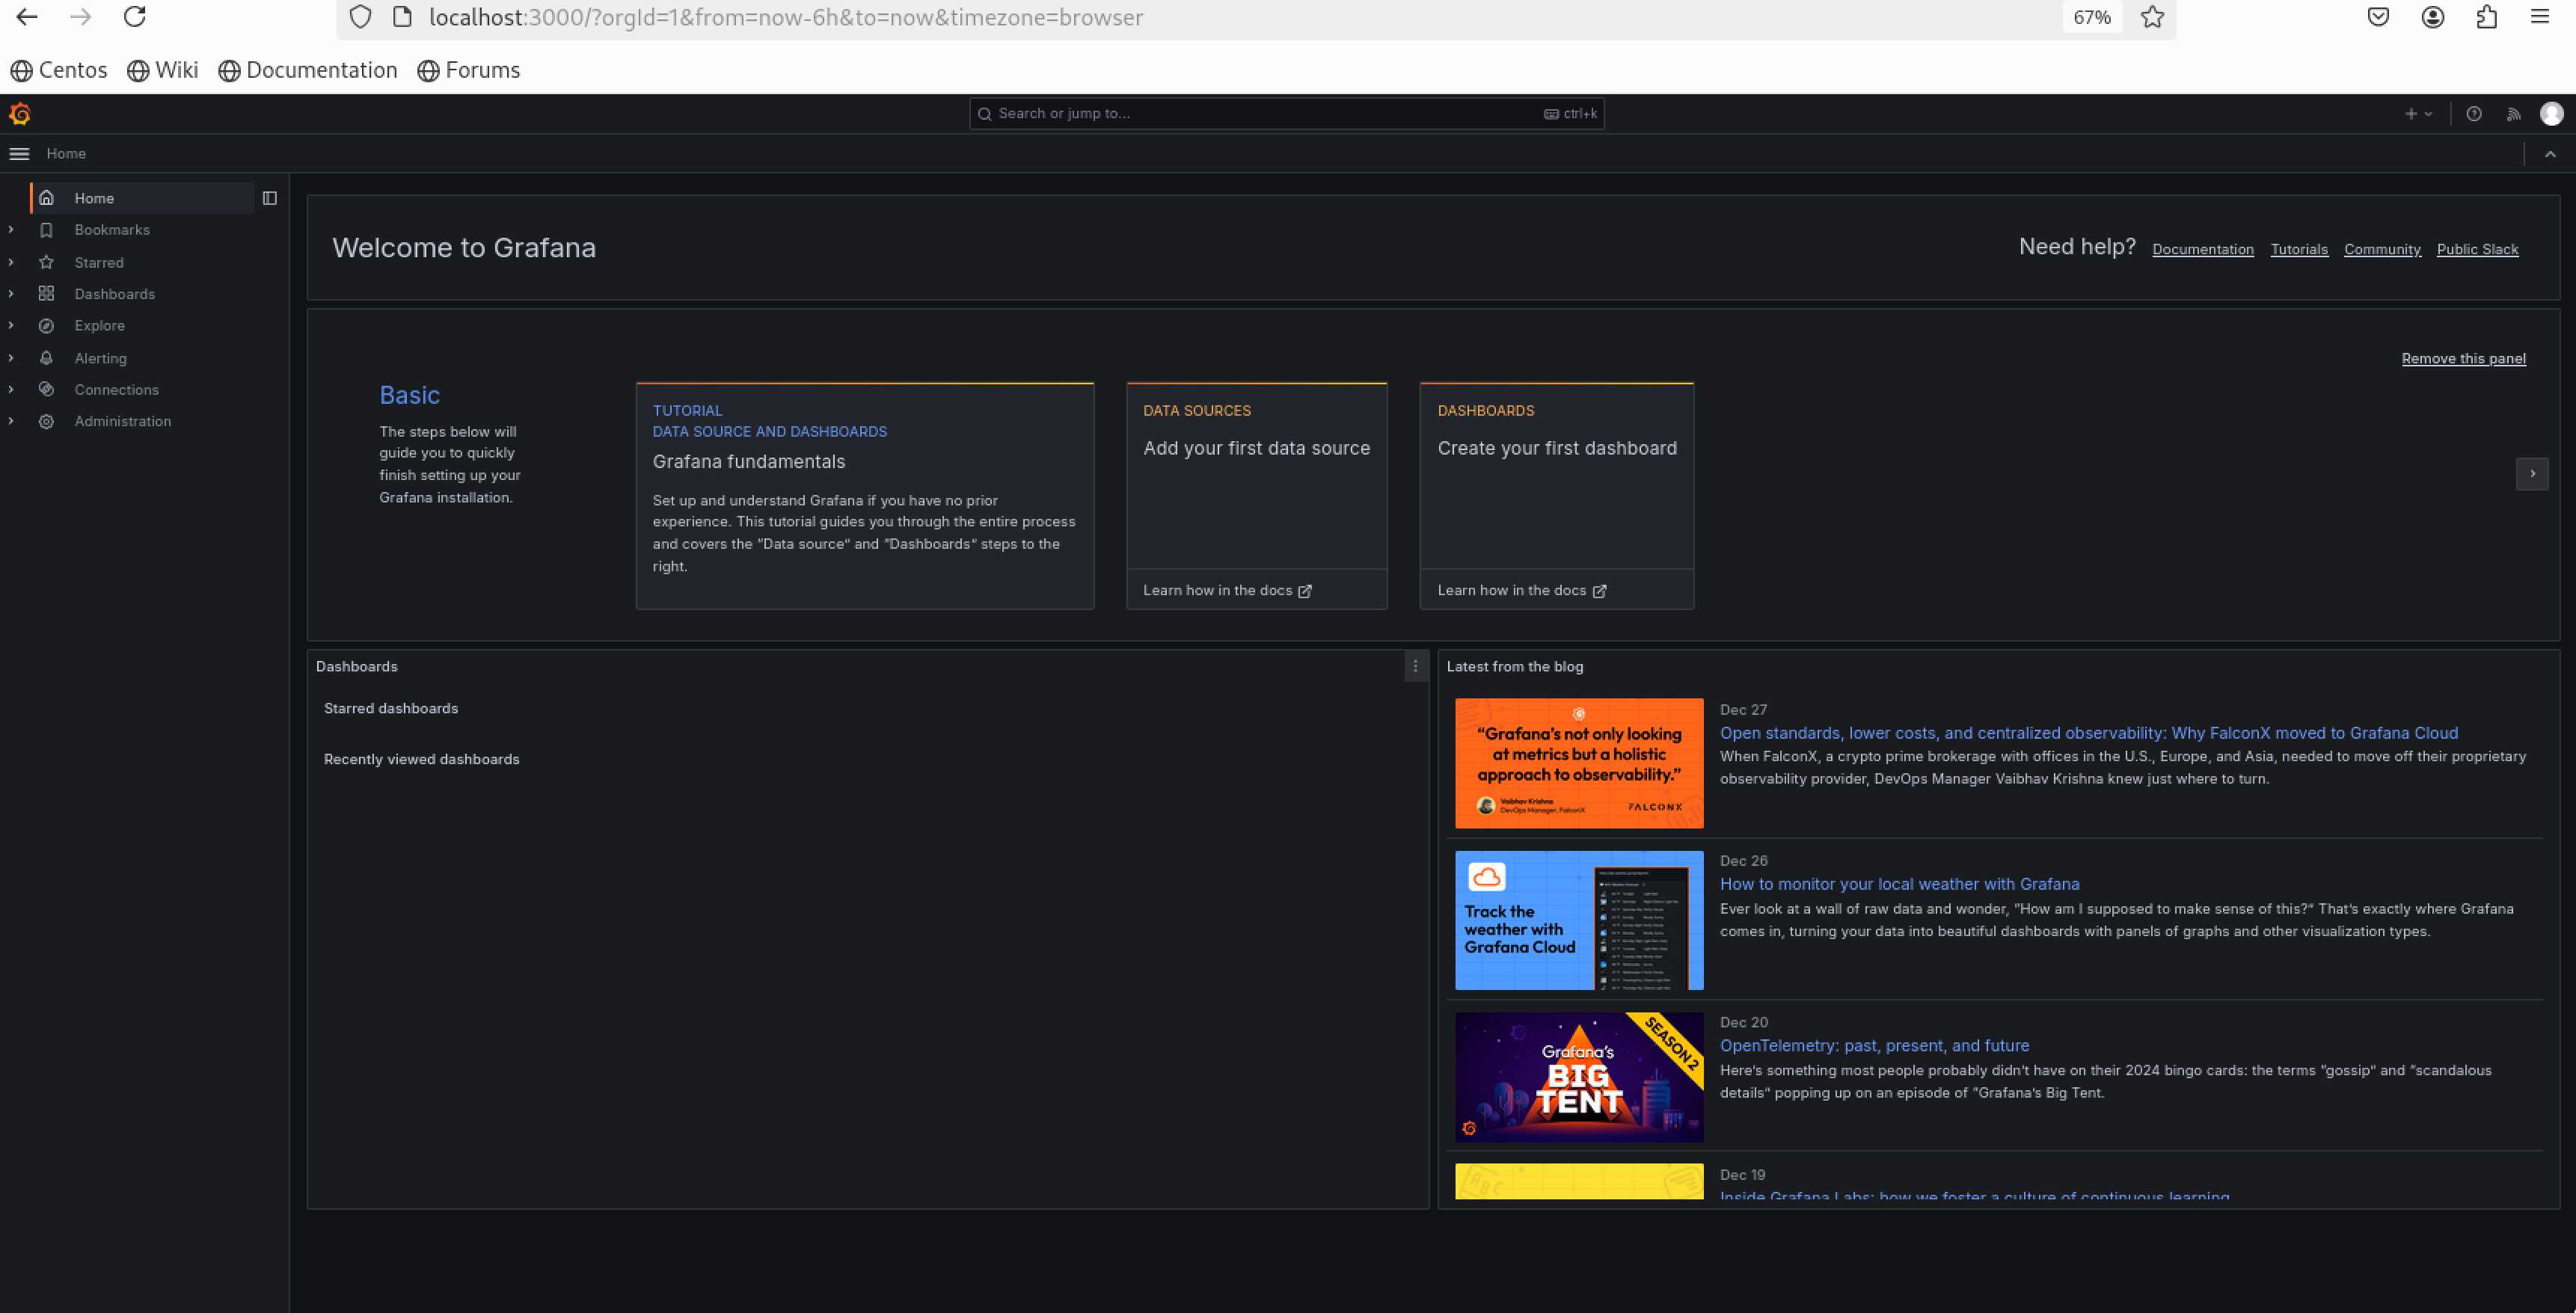
After successfully logging in you’ll see something like this
Add DataSource
To Add a
data source, underConnections, you can choose either of the options,Add New connectionorData Sources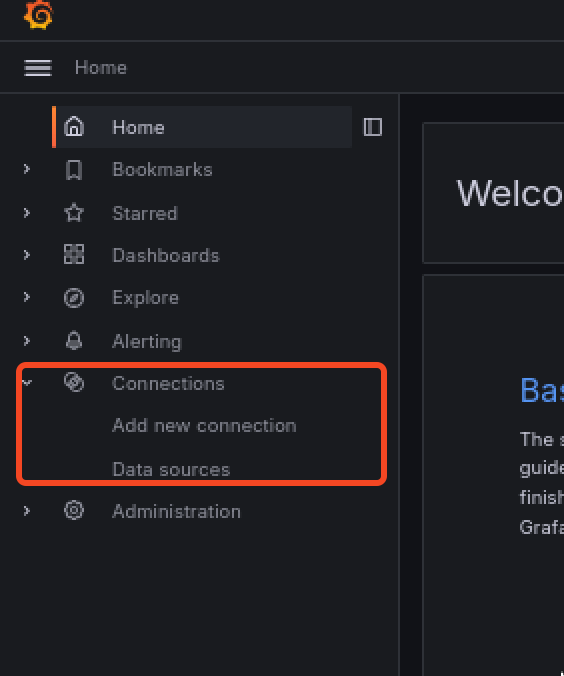
Choose the appropriate
data source. I had installedPrometheuson my local machine so chose, Prometheus.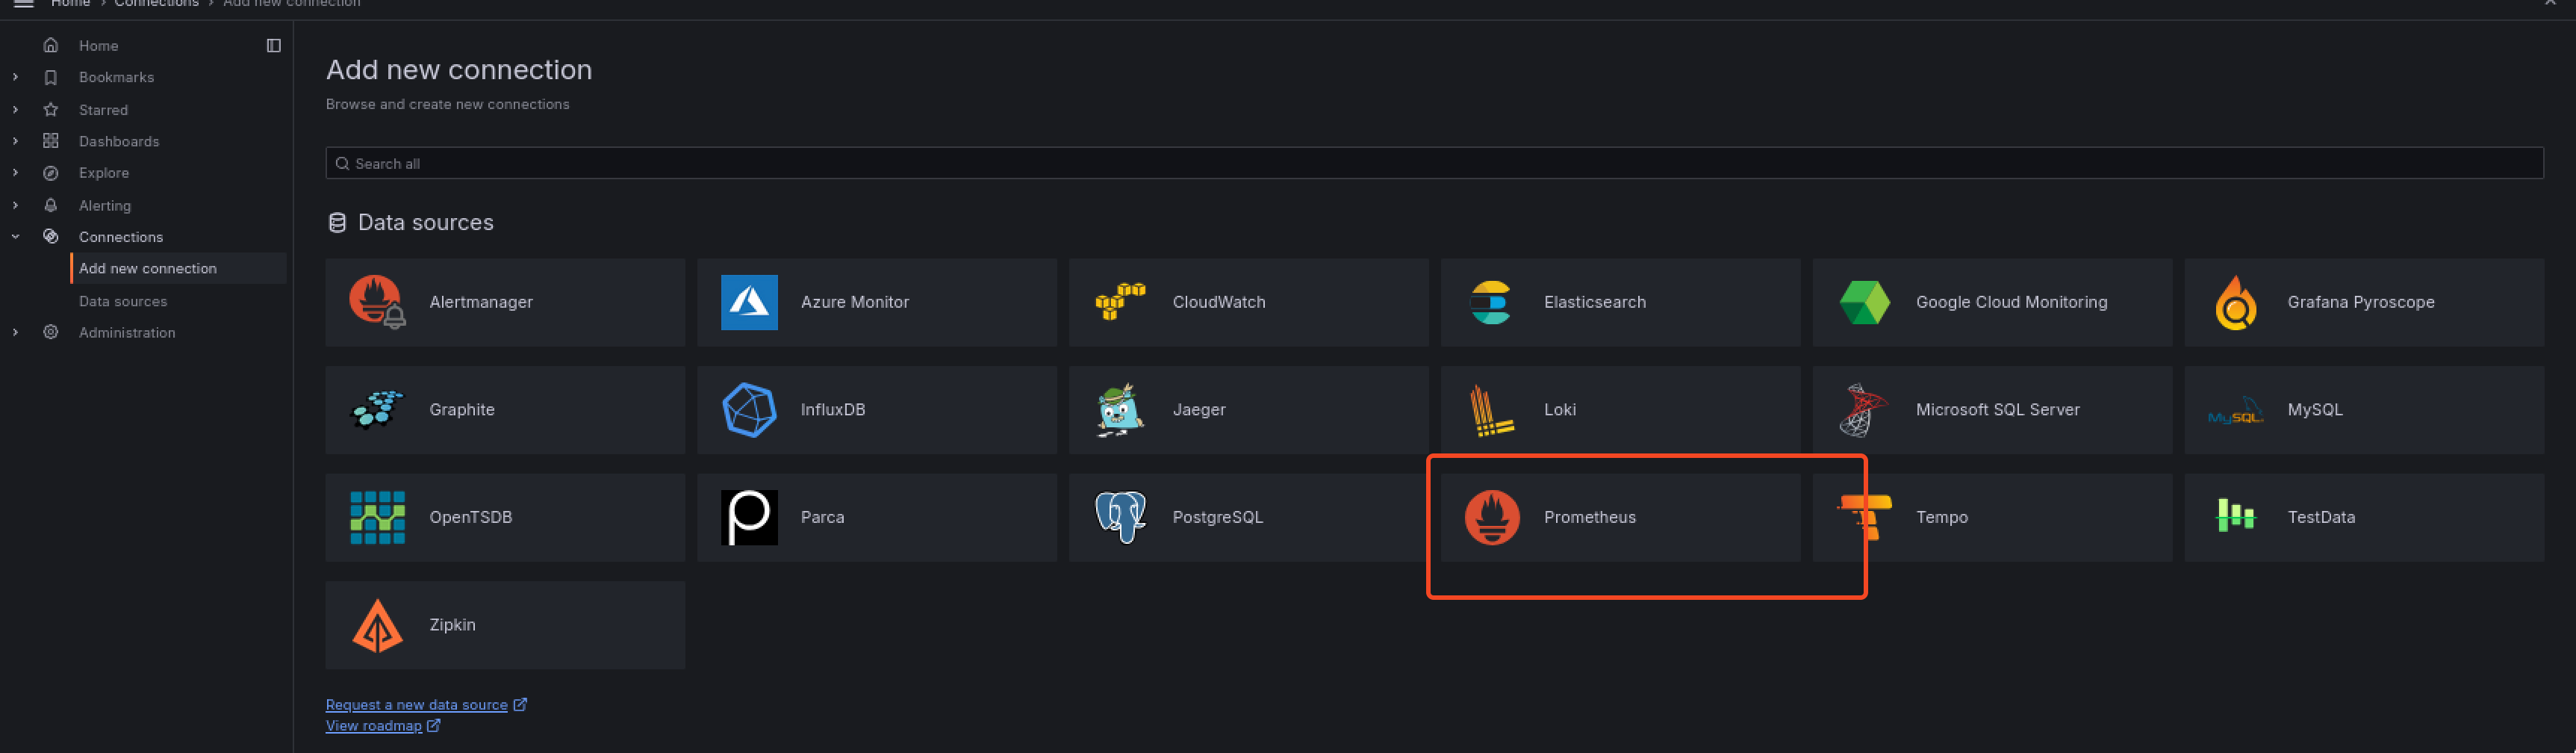
Now, After choosing the appropriate data source and adding a
connection, it’s time to add the proper details of the data source.
For now, enter the details as shown in the screenshot and click on
save testthe button. We can add more advanced details but for he understanding this much is enough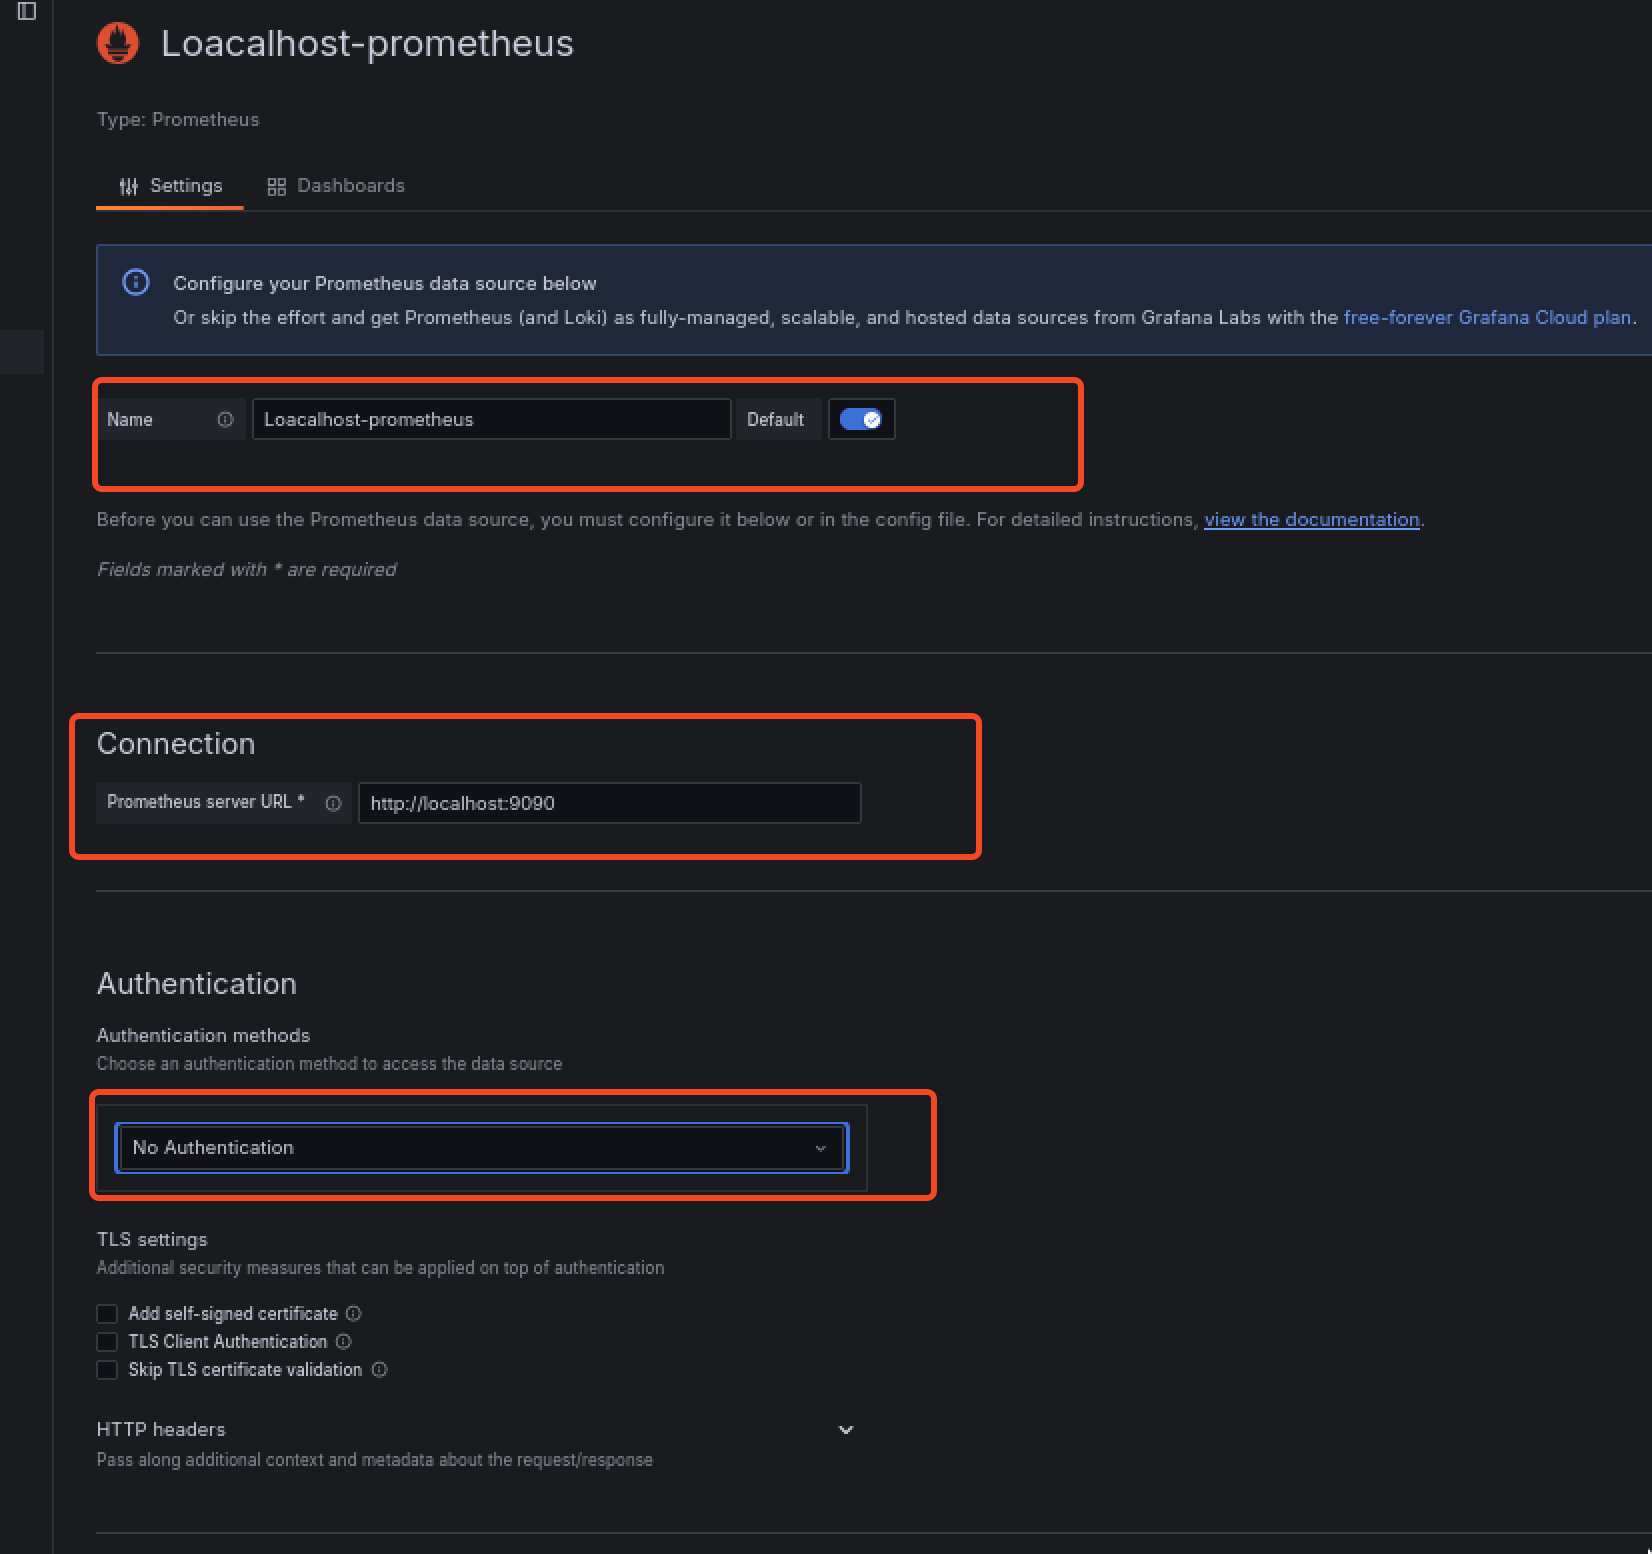
We have successfully added
data sourcegrafana. To view it navigate to thedata sourceand view the detail
Create Dashboard:
To be created…..
Issues Faced:
Problem: After the installation of Grafana on my Virtual machine, I was not able to access it on my host machine.
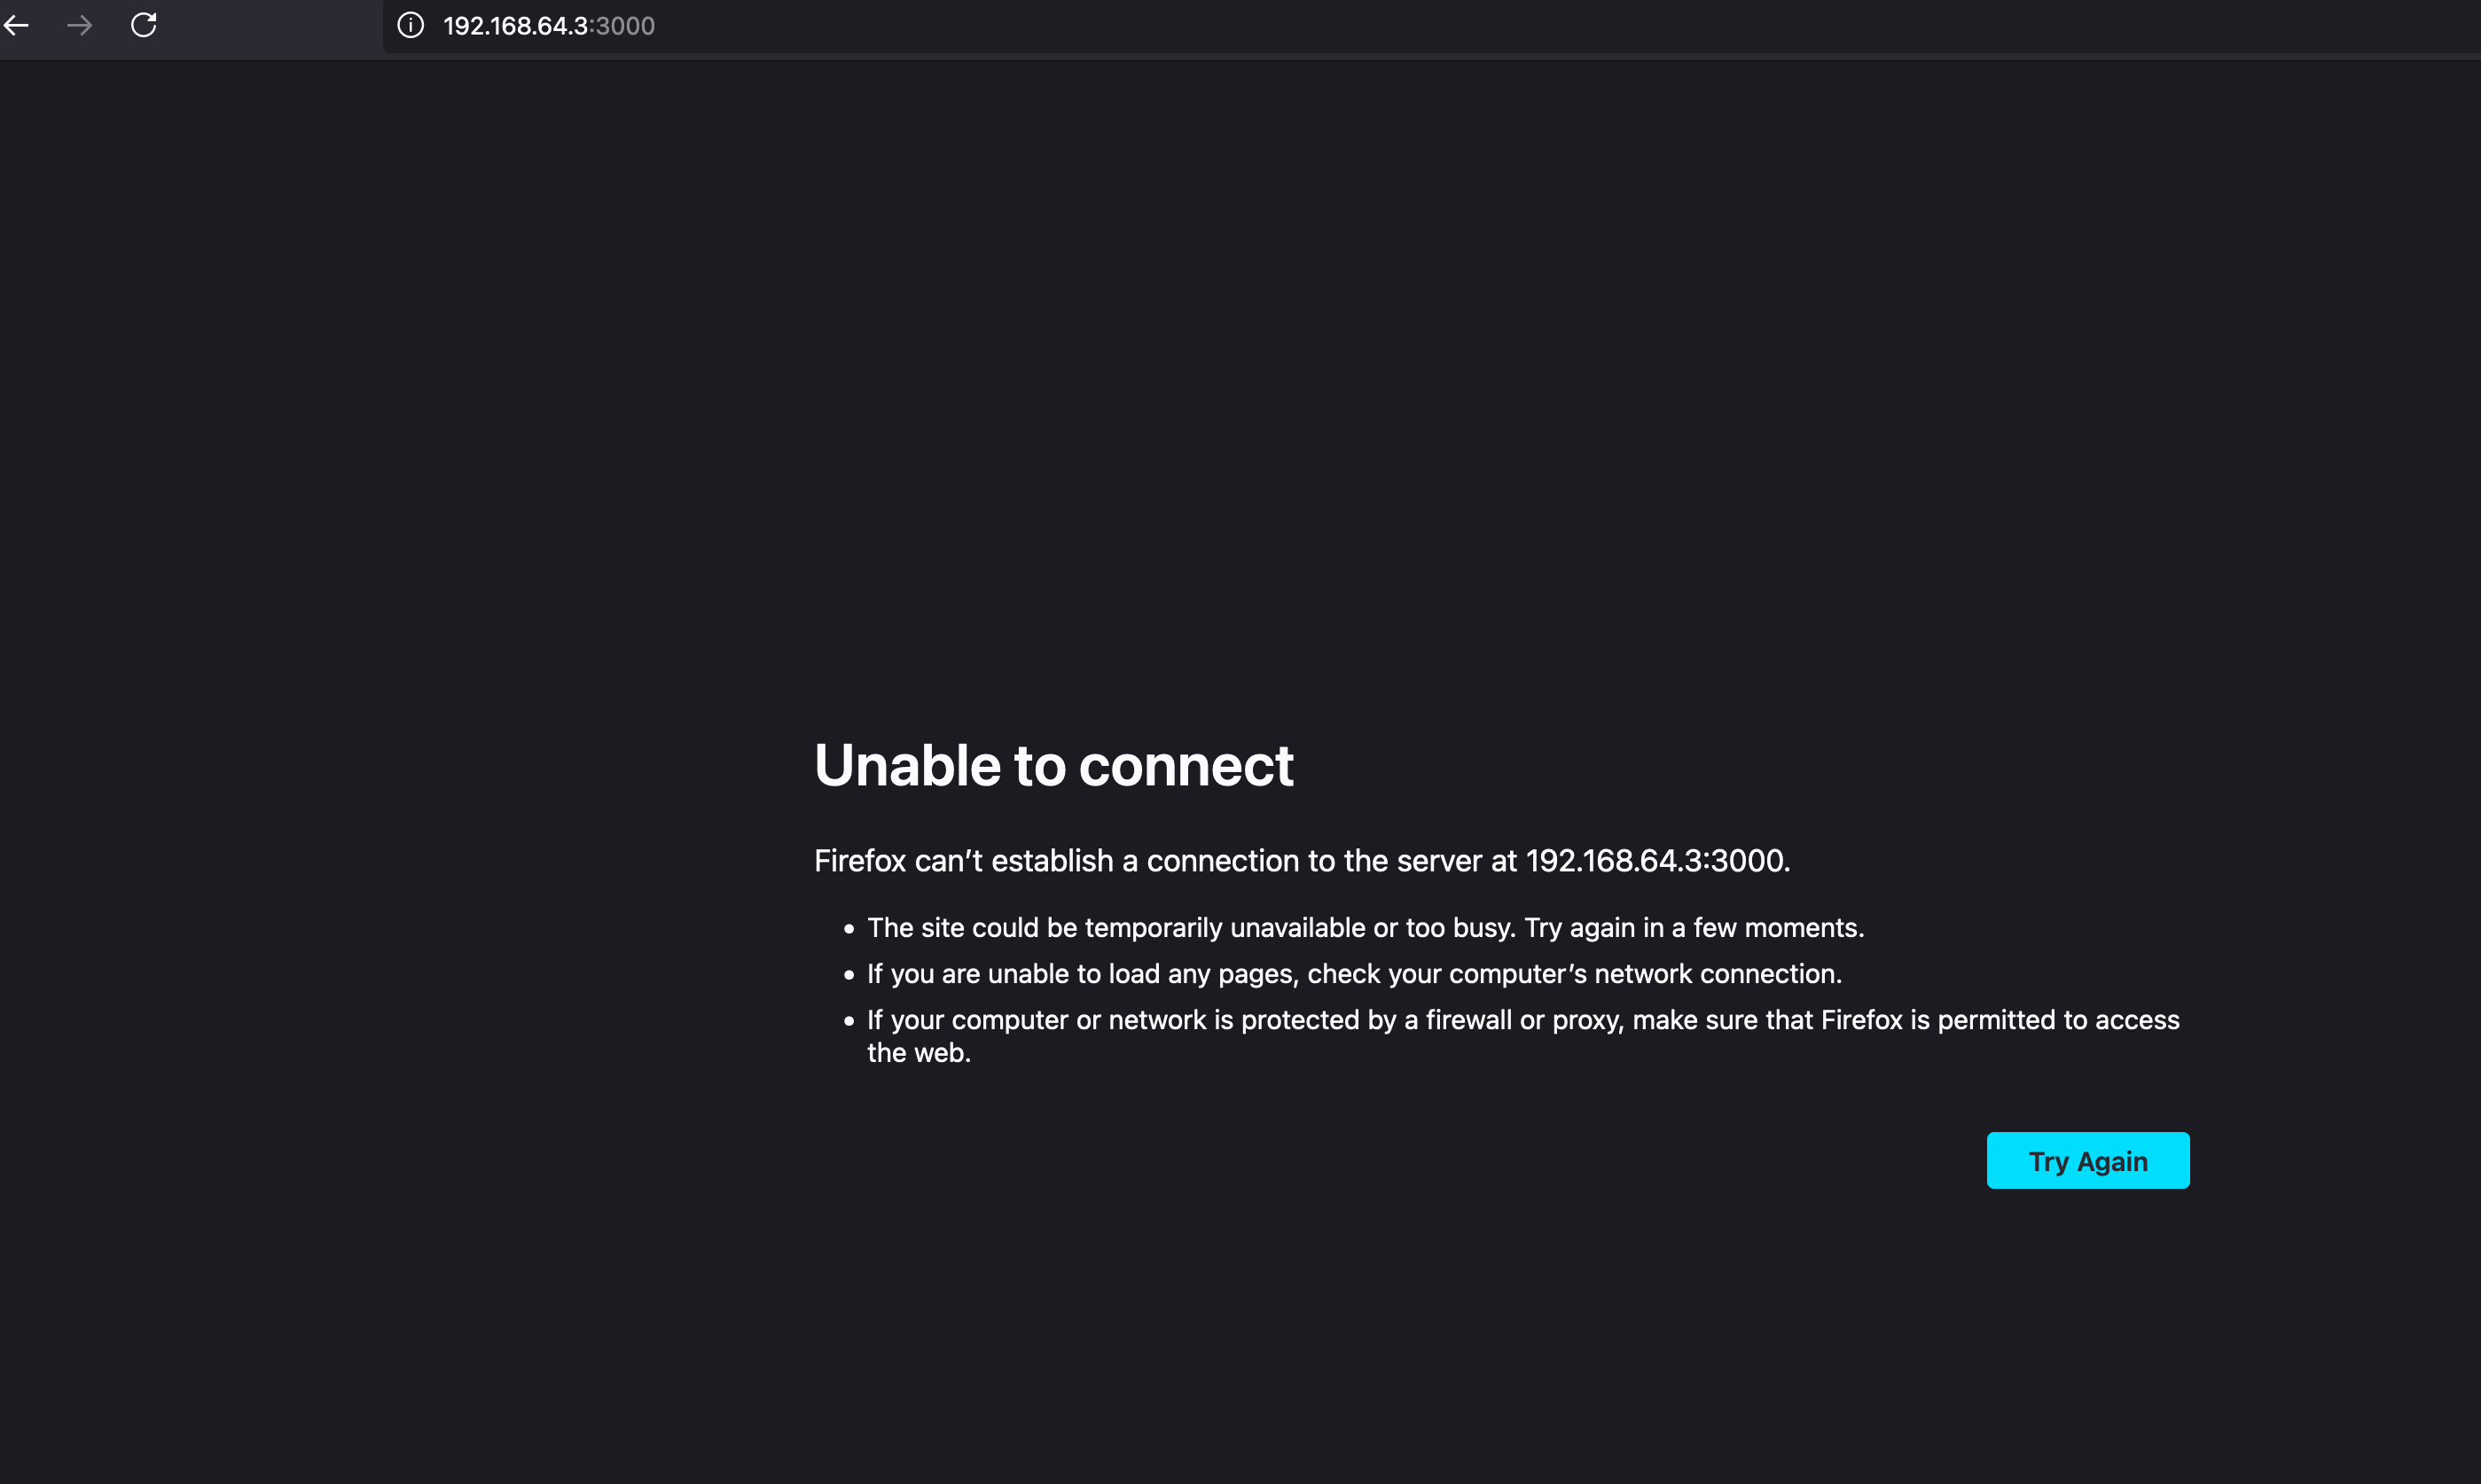
Solution: This was due to the firewall rules, I added port 3000 to allow outbound traffic to my host.
sudo firewall-cmd --add-port=3000/tcp --permanent
sudo firewall-cmd --reload
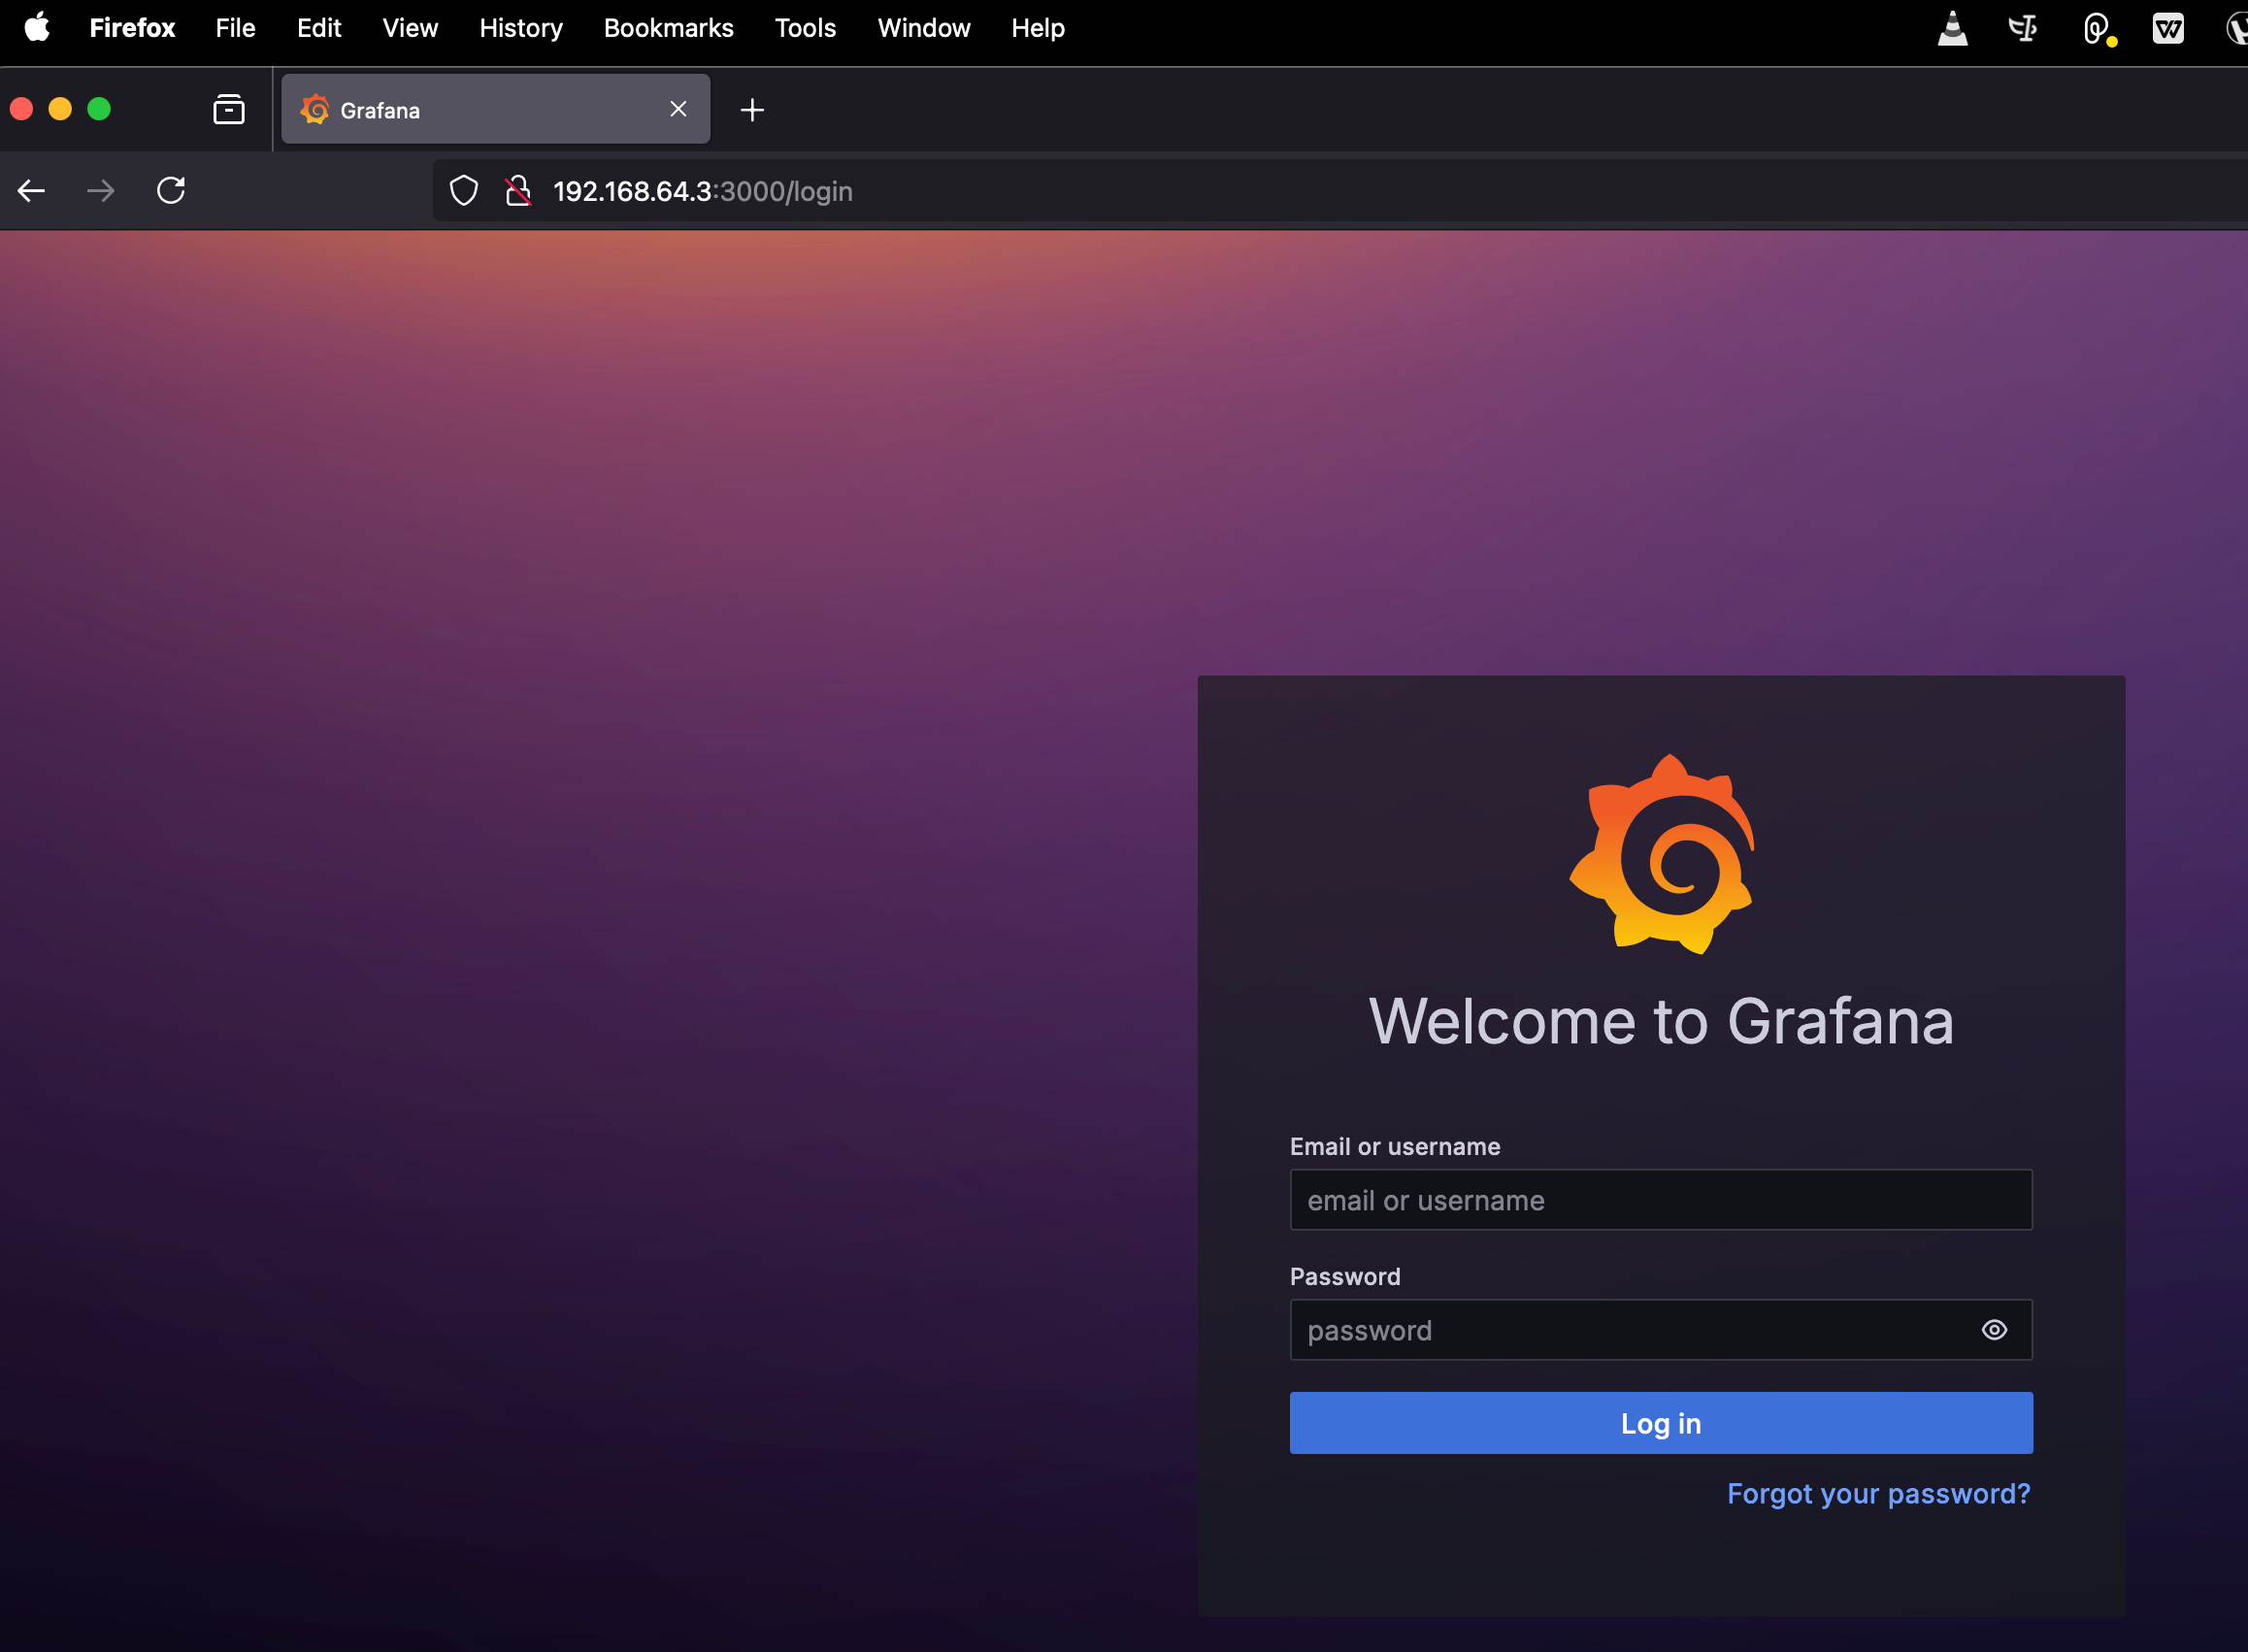
After adding this port, I was able to access the grafana on my host machine.
Knowledge
firewall-cmd Command Cheat Sheet
| Action | Command | Example |
Check if firewalld is running | firewall-cmd --state | firewall-cmd --state |
| List active zones | firewall-cmd --get-active-zones | firewall-cmd --get-active-zones |
| List all open ports | firewall-cmd --list-ports | firewall-cmd --list-ports |
| List all rules for a zone | firewall-cmd --zone=<zone> --list-all | firewall-cmd --zone=public --list-all |
| Add a port temporarily | firewall-cmd --add-port=<port>/<protocol> | firewall-cmd --add-port=3000/tcp |
| Add a port permanently | firewall-cmd --add-port=<port>/<protocol> --permanent | firewall-cmd --add-port=3000/tcp --permanent |
| Remove a port temporarily | firewall-cmd --remove-port=<port>/<protocol> | firewall-cmd --remove-port=3000/tcp |
| Remove a port permanently | firewall-cmd --remove-port=<port>/<protocol> --permanent | firewall-cmd --remove-port=3000/tcp --permanent |
| Reload firewall rules | firewall-cmd --reload | firewall-cmd --reload |
| List all services | firewall-cmd --get-services | firewall-cmd --get-services |
| Allow a service temporarily | firewall-cmd --add-service=<service> | firewall-cmd --add-service=http |
| Allow a service permanently | firewall-cmd --add-service=<service> --permanent | firewall-cmd --add-service=http --permanent |
| Remove a service temporarily | firewall-cmd --remove-service=<service> | firewall-cmd --remove-service=http |
| Remove a service permanently | firewall-cmd --remove-service=<service> --permanent | firewall-cmd --remove-service=http --permanent |
| Set a default zone | firewall-cmd --set-default-zone=<zone> | firewall-cmd --set-default-zone=public |
| Add a source IP to a zone | firewall-cmd --zone=<zone> --add-source=<source> | firewall-cmd --zone=public --add-source=192.168.1.0/24 |
| Remove a source IP from a zone | firewall-cmd --zone=<zone> --remove-source=<source> | firewall-cmd --zone=public --remove-source=192.168.1.0/24 |
| Enable masquerading (NAT) | firewall-cmd --zone=<zone> --add-masquerade | firewall-cmd --zone=public --add-masquerade |
| Disable masquerading | firewall-cmd --zone=<zone> --remove-masquerade | firewall-cmd --zone=public --remove-masquerade |
| Rich rule: Add rule | firewall-cmd --zone=<zone> --add-rich-rule='<rule>' | firewall-cmd --zone=public --add-rich-rule='rule family="ipv4" source address="192.168.1.1" accept' |
| Rich rule: Remove rule | firewall-cmd --zone=<zone> --remove-rich-rule='<rule>' | firewall-cmd --zone=public --remove-rich-rule='rule family="ipv4" source address="192.168.1.1" accept' |
| Enable logging for a zone | firewall-cmd --zone=<zone> --set-log-denied=all | firewall-cmd --zone=public --set-log-denied=all |
| Disable logging for a zone | firewall-cmd --zone=<zone> --set-log-denied=off | firewall-cmd --zone=public --set-log-denied=off |


